Constructing CSG geometry#
This Python notebook allows users to build upon the geometry constructed in Part 1 by adding a center column to the model.
The center column requires a different surface type. OpenMC has several different surface types in addition to spheres. The documentation contains useful information on all surface types supported: https://openmc.readthedocs.io/en/stable/usersguide/geometry.html#surfaces-and-regions.
First import OpenMC and configure the nuclear data path
import openmc
from pathlib import Path
# Setting the cross section path to the correct location in the docker image.
# If you are running this outside the docker image you will have to change this path to your local cross section path.
openmc.config['cross_sections'] = Path.home() / 'nuclear_data' / 'cross_sections.xml'
For the center column we will use a cylinder with Z axis orientation.
The code block below shows how the center column can be defined.
# surfaces
central_column_surface = openmc.ZCylinder(r=100) # note the new surface type
inner_sphere_surface = openmc.Sphere(r=480)
middle_sphere_surface = openmc.Sphere(r=500)
outer_sphere_surface = openmc.Sphere(r=600, boundary_type='vacuum')
# regions
# the center column region is cut at the top and bottom using the -outer_sphere_surface
central_column_region = -central_column_surface & -outer_sphere_surface
firstwall_region = -middle_sphere_surface & +inner_sphere_surface & +central_column_surface
blanket_region = +middle_sphere_surface & -outer_sphere_surface & +central_column_surface
inner_vessel_region = +central_column_surface & -inner_sphere_surface
# cells
firstwall_cell = openmc.Cell(region=firstwall_region)
central_column_cell = openmc.Cell(region=central_column_region)
blanket_cell = openmc.Cell(region=blanket_region)
inner_vessel_cell = openmc.Cell(region=inner_vessel_region)
geometry = openmc.Geometry([central_column_cell, firstwall_cell, blanket_cell, inner_vessel_cell])
# visualization
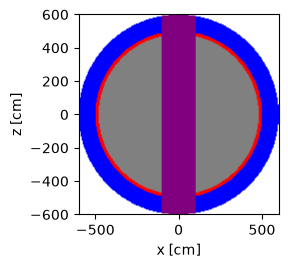
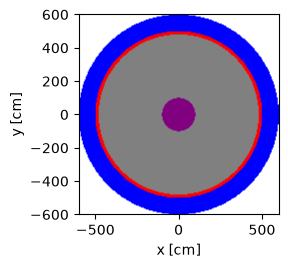
color_assignment = {blanket_cell: 'blue', firstwall_cell: 'red',
inner_vessel_cell:'grey', central_column_cell:'purple'}
plot = geometry.plot(basis='xz', color_by='cell', colors=color_assignment)
plot.figure.savefig('xz-cell.png')
plot = geometry.plot(basis='xy', color_by='cell', colors=color_assignment)
plot.figure.savefig('xy-cell.png')
plot = geometry.plot(basis='yz', color_by='cell', colors=color_assignment)
plot.figure.savefig('yz-cell.png')

Another way to add the center column shape is to use Boolean operators. This is shown in the code block below.
# surfaces
central_column_surface = openmc.ZCylinder(r=100) # note the new surface type
inner_sphere_surface = openmc.Sphere(r=480)
middle_sphere_surface = openmc.Sphere(r=500)
outer_sphere_surface = openmc.Sphere(r=600, boundary_type='vacuum')

# regions, this time defined using boolean operators
# There are 3 operators to choose from
#     | OR
#     & AND
#     ~ NOT
# This examples uses the ~ NOT operators

central_column_region = -central_column_surface & -outer_sphere_surface

# the inner_vessel_region is defined using the logical NOT operator ~
inner_vessel_region = -inner_sphere_surface & ~central_column_region

# the firstwall_region is defined as below the middle surface and not in two other regions
firstwall_region = -middle_sphere_surface & ~inner_vessel_region & ~central_column_region

# the blanket_region is defined as between two surfaces and not the center_column_region
blanket_region = +middle_sphere_surface & -outer_sphere_surface & ~central_column_region


# cells defined in the same way
firstwall_cell = openmc.Cell(region=firstwall_region)
central_column_cell = openmc.Cell(region=central_column_region)
blanket_cell = openmc.Cell(region=blanket_region)
inner_vessel_cell = openmc.Cell(region=inner_vessel_region)

geometry = openmc.Geometry([central_column_cell, firstwall_cell, blanket_cell, inner_vessel_cell])

# VISUALISATION
color_assignment = {blanket_cell: 'blue', firstwall_cell: 'red',
                    inner_vessel_cell:'grey', central_column_cell:'purple'}

plot = geometry.plot(basis='xz', color_by='cell', colors=color_assignment)
plot.figure.savefig('xz-cell.png')

plot = geometry.plot(basis='xy', color_by='cell',  colors=color_assignment)
plot.figure.savefig('xy-cell.png')

plot = geometry.plot(basis='yz', color_by='cell',  colors=color_assignment)
plot.figure.savefig('yz-cell.png')
More details on CSG geometry construction methods can be found here: https://docs.openmc.org/en/stable/usersguide/geometry.html.
Additionally, OpenMC has a geometry viewing package which can be found here: openmc-dev/plotter.
Learning Outcomes for Part 2:
Using different surface types in OpenMC to construct CSG.
Defining geometry surfaces, regions and cells.
Bonus knowledge
There is an excellent geometry viewing package for OpenMC that also supports mesh tally visualization. openmc-dev/plotter